 RUNNING ENGINEERS
For Runners. By Runners.
Understand your running form

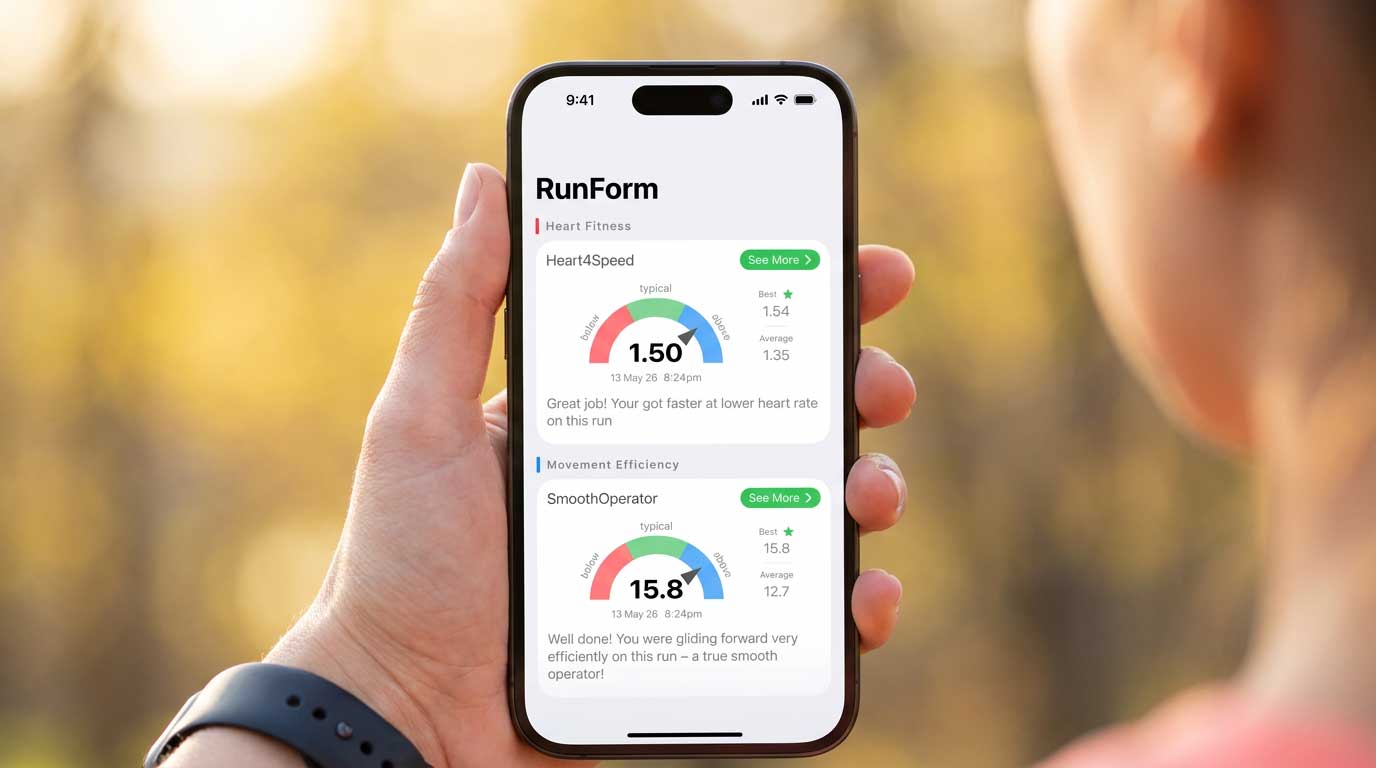
Check your Heart Fitness and Movement Efficiency scores. Built on science, made simple for everyday runners. The RunForm app measures two key indicators: Heart4Speed and SmoothOperator.

Heart4Speed
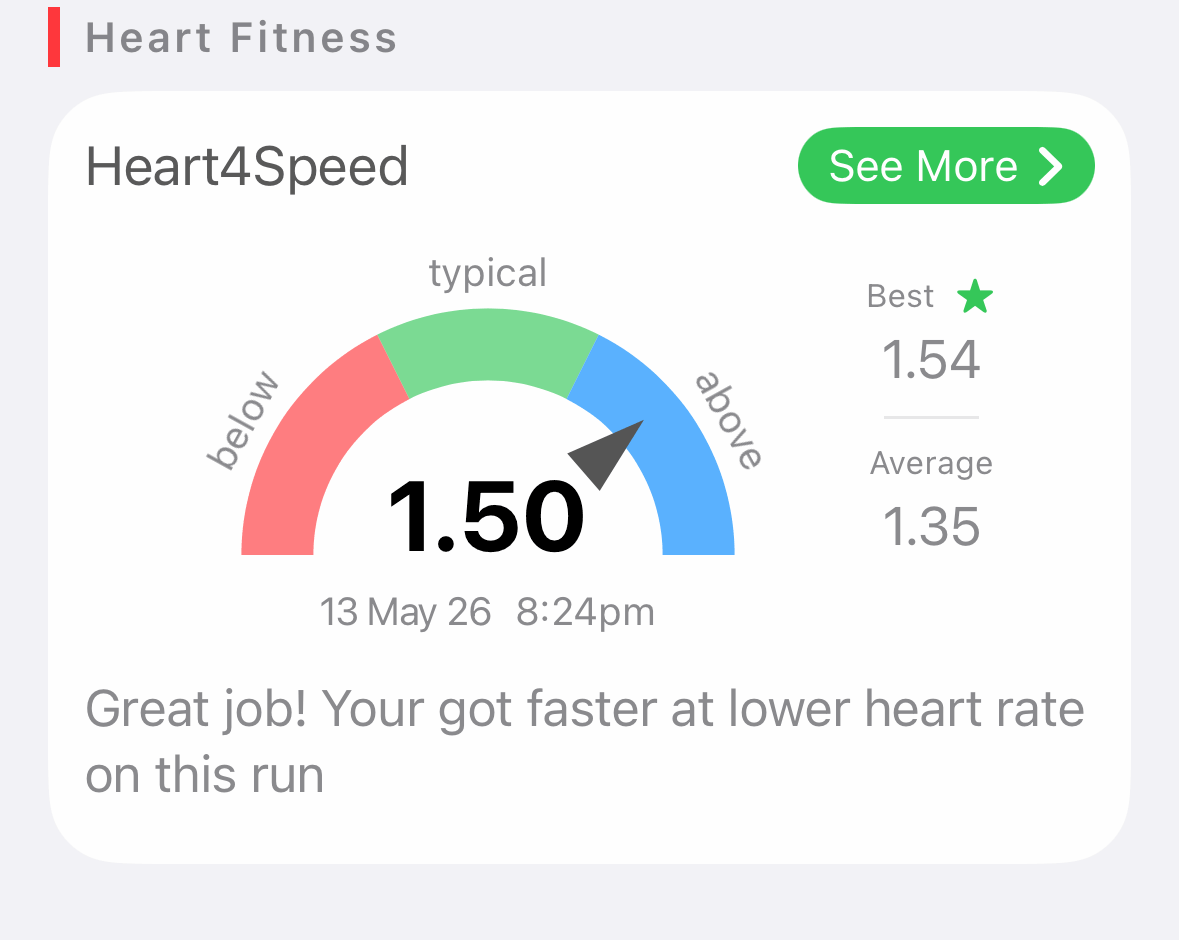
This is your running engine efficiency — how much speed your body produces for every single heartbeat. This tracks your aerobic fitness and running economy combined. A higher number means your heart is working smarter, not harder — you're getting more miles/kilometres per hour out of every pump of your heart.
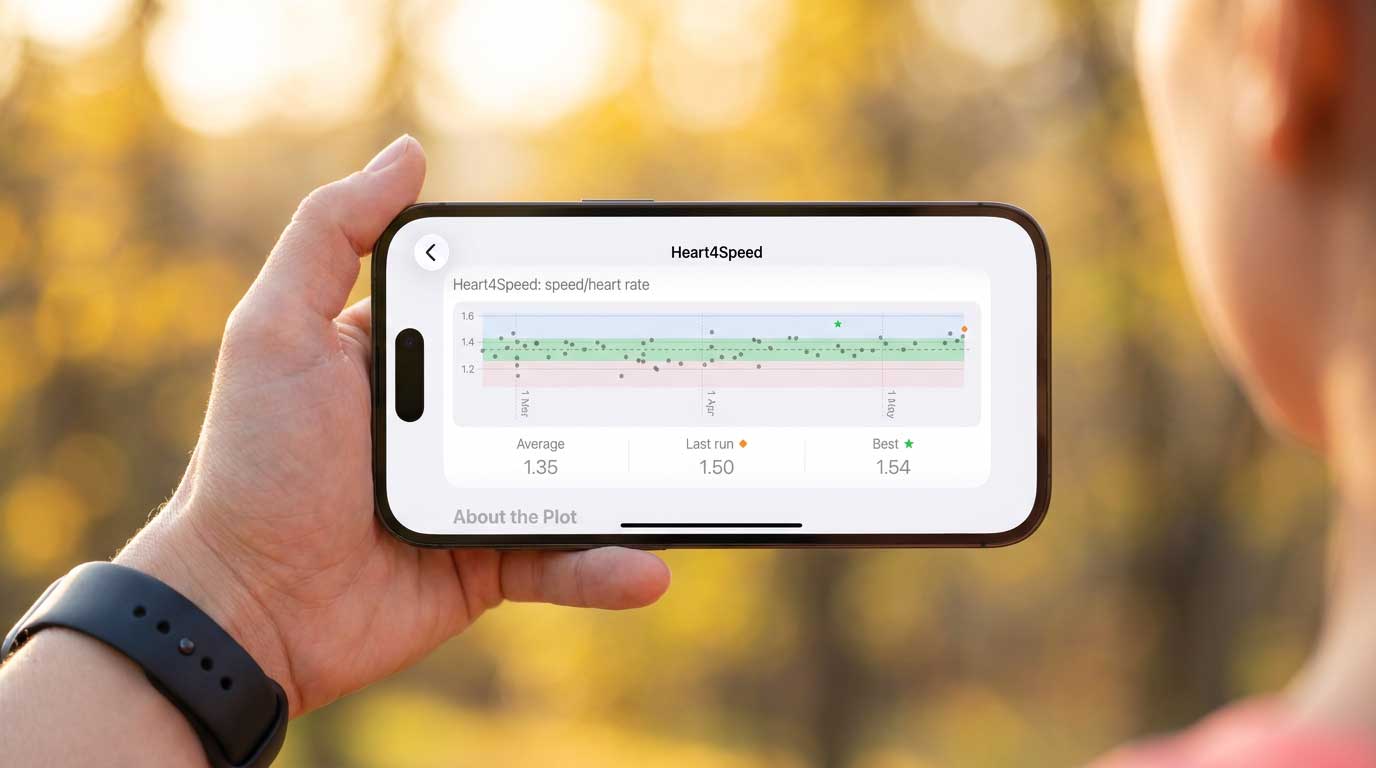
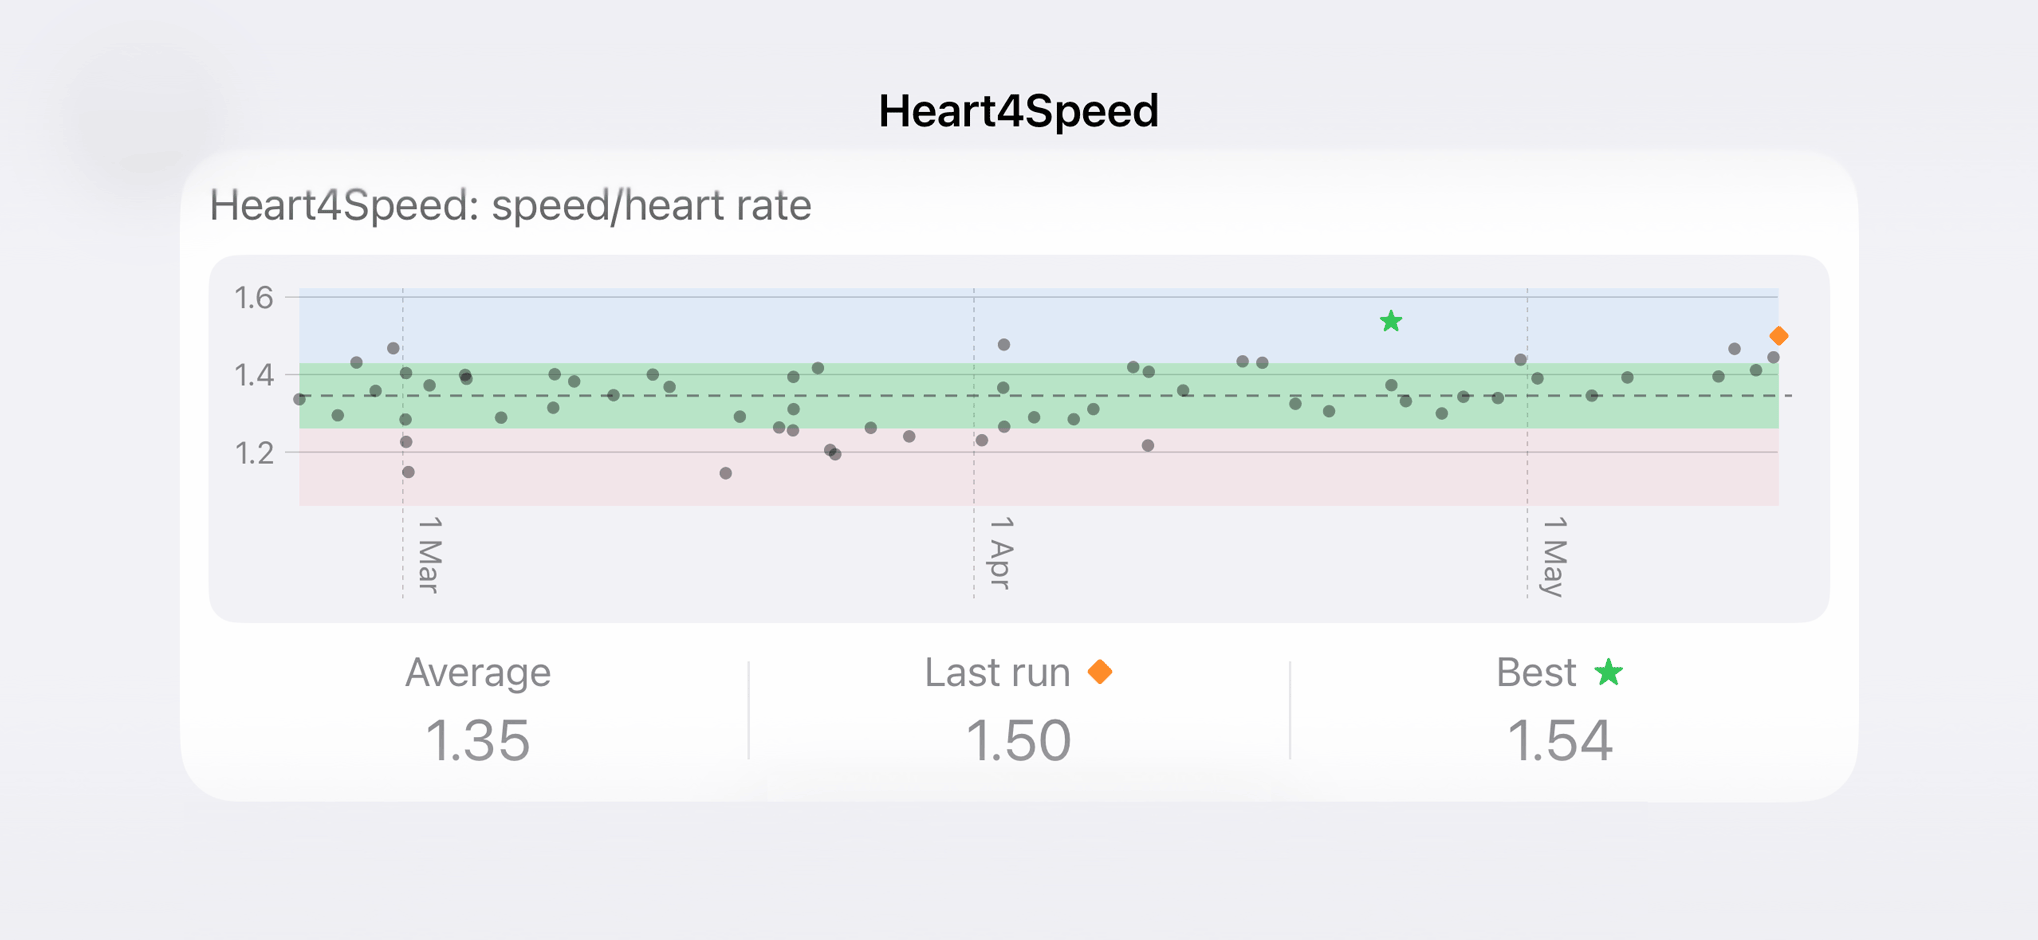
Review each run against your personal 12-week typical range (green band). This helps you spot trends early and adjust training before fatigue accumulates.
Move Your Body, Feel Your Rhythm
Why Does It Matter?
When you run, your muscles need oxygen to produce energy. Your heart delivers that oxygen through your blood. The faster you want to run, the harder your heart has to work — and the higher your heart rate climbs. But here's the good news: training makes your heart more efficient. Over weeks and months of consistent training, runners develop the ability to run faster and longer at the same heart rate. This is one of the clearest, most measurable signs that your aerobic fitness is genuinely improving.
What Does Your Reading Tell You?
The green band on your chart shows your personal 12-week typical range. It is calculated from your own history, so it reflects your body, not an average runner's.
| Reading | What it likely means |
|---|---|
| Inside the green band | Your cardiovascular system performed as expected for a run like this. |
| Above the green band | A great day — your heart was working particularly efficiently. |
| Below the green band | Your heart worked harder than usual for the speed you ran. |
A single reading below the band is not a cause for concern. Focus on the trend over 4–8 weeks.
Why Does It Vary Between Runs?
Heart4Speed is heart rate-based, which means anything that affects your heart rate will also affect your Heart4Speed. This is completely normal.
- Heat and humidity — Your heart pumps harder to cool your body, raising heart rate even at the same pace. Expect Heart4Speed to drop noticeably in summer.
- Cold and wind — Cold muscles are less efficient; running into a headwind costs more energy.
- Hills and terrain — Climbing requires more effort. Even after grade adjustments, rough or uneven terrain adds metabolic cost.
- Run type — An easy recovery jog and a tempo run serve completely different purposes. A hard interval session will naturally produce a different Heart4Speed than a long, steady aerobic run.
- Fatigue, stress and sleep — A poor night's sleep or a stressful week can raise resting heart rate, dragging your Heart4Speed down even if you run just as well.
- Caffeine, hydration, illness — All shift heart rate, and therefore Heart4Speed.
This is why the app shows your personal 12-week typical range rather than a fixed target number — it adapts to your patterns across different conditions.
Should You Be Concerned If It's Below the Green Band?
Not automatically — no.
One low reading is data, not a verdict. Ask yourself:
- Was it an unusually hot or humid day?
- Did you run a hilly route?
- Was this a hard effort run (intervals, tempo)?
- Have you had disrupted sleep or a stressful week?
- Are you fighting off a cold?
If the answer to any of these is yes, a lower Heart4Speed is entirely expected and you can move on.
When to pay attention: If your Heart4Speed sits below the green band across multiple consecutive easy runs with no obvious external cause, it may be signalling that your body needs more recovery time, or that your aerobic base needs attention.
How to Improve It Over Time?
Heart4Speed responds to consistent, patient aerobic training. There are no shortcuts, but there is a clear path:
- Build your aerobic base. The single most effective strategy is more time running at easy, conversational effort (what coaches call Zone 2). This is where your cardiovascular adaptations happen.
- Prioritise recovery. Heart4Speed improves between runs, not during them. Sleep, easy days, and proper nutrition are when adaptation occurs.
- Add strength training. Strength and plyometric training can improve running economy, which directly feeds into better Heart4Speed.
- Be consistent over weeks, not days. Heart4Speed trends upward over 6–12 weeks of solid training, not after one good session.
- Work with a coach. A running coach can help you balance easy aerobic work with quality sessions to improve Heart4Speed without overloading your body.
SmoothOperator
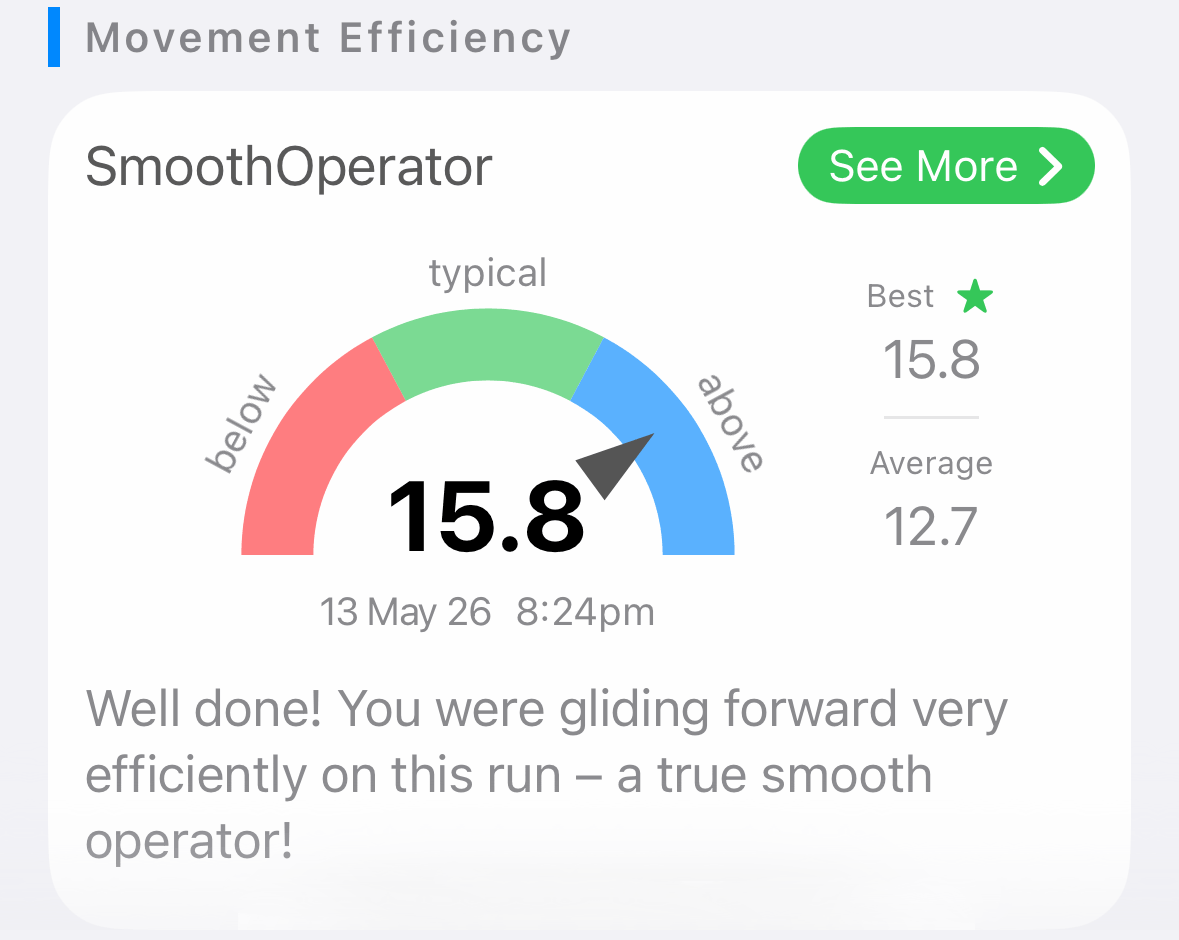
SmoothOperator measures the amount of energy we transfer into forward motion per step when running.
Every time you take a stride, your body moves in two directions at once: forward (which is the goal) and up and down (which costs you energy). SmoothOperator tracks the ratio of forward motion to vertical bounce. A higher SmoothOperator means you're spending more energy going forward and wasting less energy on bouncing up and down.
Turn Energy Into Forward Motion
Why Does It Matter?
Running economy — your body's ability to convert energy into forward motion efficiently — is one of the strongest predictors of distance running performance. Research published in Sports Medicine (Moore, 2016) identified lower vertical oscillation as one of the most consistently beneficial modifiable biomechanical factors for running economy.
Legendary coach Jack Daniels (Daniels' Running Formula) describes minimising vertical displacement relative to forward progress as a core principle of efficient running technique. Elite runners tend to have a "flat" trajectory — they glide forward, they don't pogo-stick.
A runner completing a marathon at 3:30 takes over 35,000 strides. If each stride contains just 1 cm of unnecessary bounce, that adds up to significant wasted energy over a race — energy that could have gone into speed or endurance.
Unlike Heart4Speed, which reflects your cardiovascular system, SmoothOperator is a biomechanical metric — it tells you directly about your running form and technique.
What Does Your Reading Tell You?
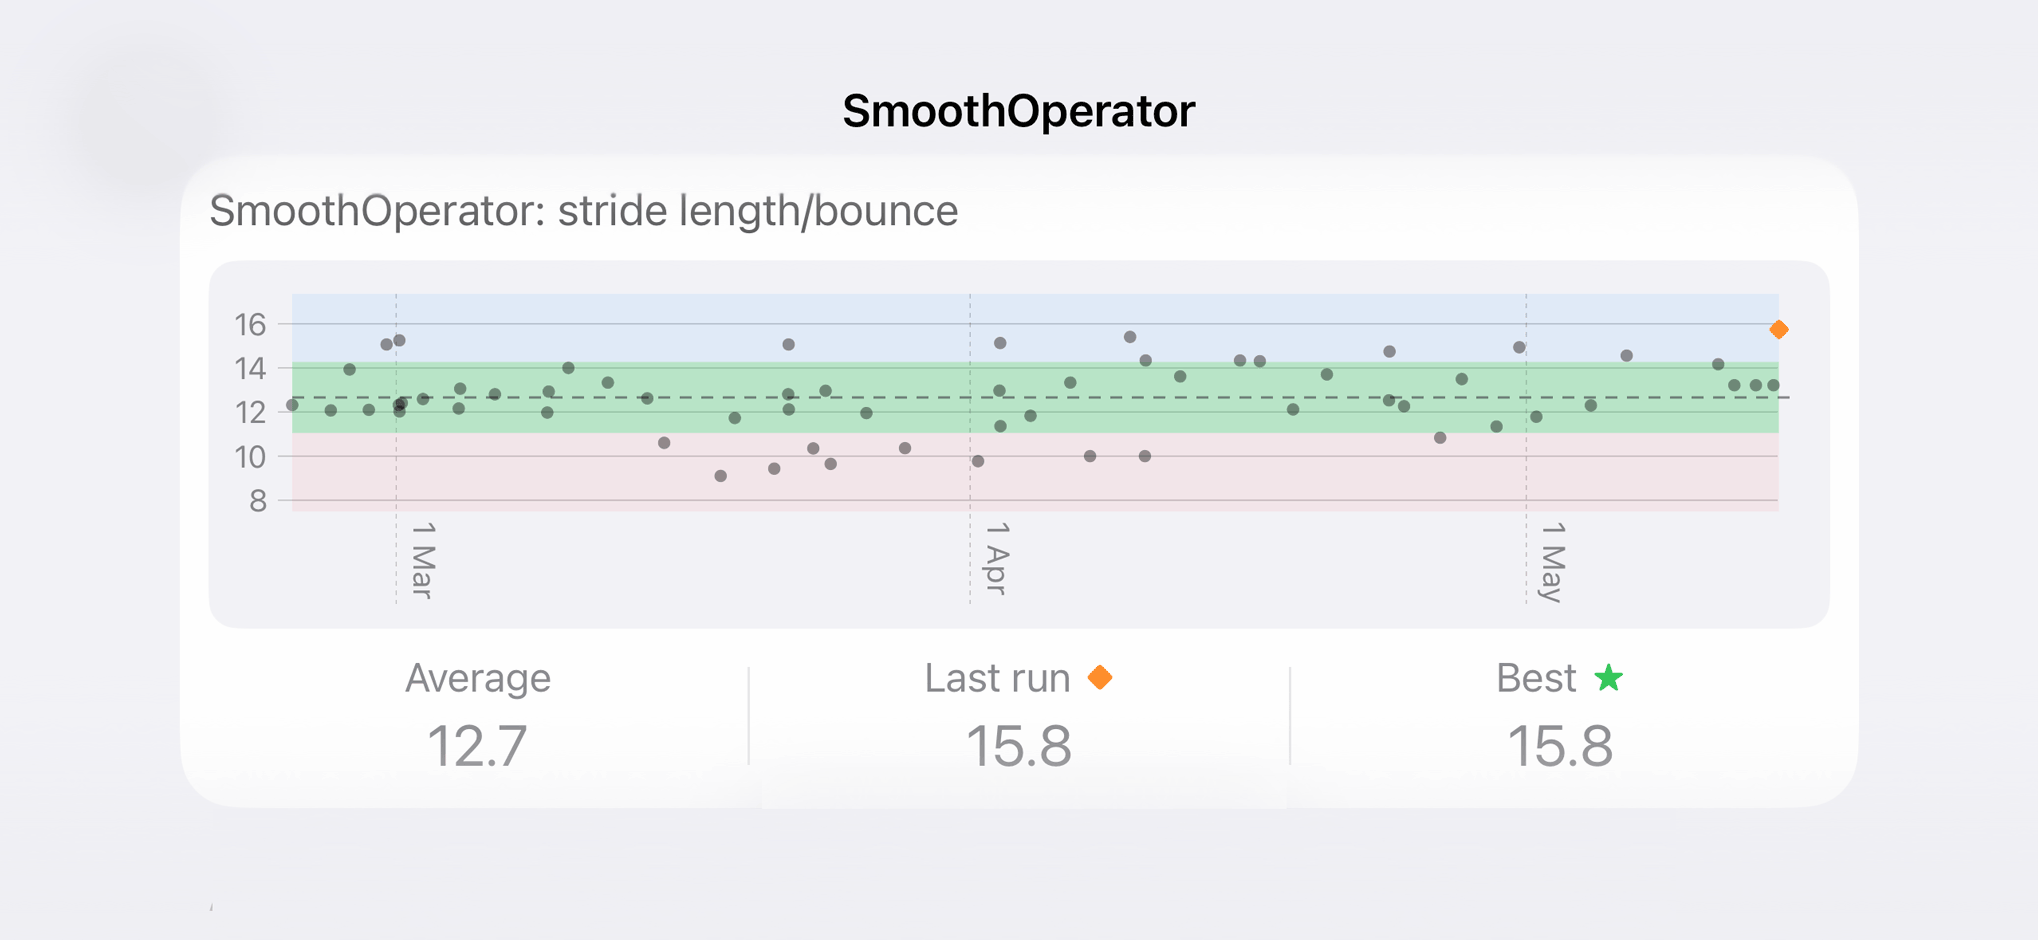
The green band on your chart shows your personal 12-week typical range. It is calculated from your own history, so it reflects your body and stride patterns.
| Reading | What it likely means |
|---|---|
| Inside the green band | Your running form is as expected for a run at this effort. |
| Above the green band | Great form — more efficient stride than your typical pattern. |
| Below the green band | You likely had more bouncing movement or less efficient mechanics than usual. |
A single low reading is not a cause for concern. Focus on the trend over 4–8 weeks.
Why Does It Vary Between Runs?
SmoothOperator changes naturally with pace, terrain, fatigue, and day-to-day running conditions.
- Pace and workout type — Easy runs and hard sessions produce different stride mechanics. This means your interval and tempo runs will naturally show better values than your easy long runs.
- Terrain and elevation — Hills, turns, and uneven ground can increase vertical movement.
- Fatigue and recovery status — Tired legs often lose rhythm and spring, reducing efficiency.
- Shoes and surface — Footwear and running surface can influence impact and bounce patterns.
That is why the app compares each run with your personal 12-week typical range, not a single fixed target.
Should You Be Concerned If It's Below the Green Band?
Not automatically — no.
One lower run can happen for many normal reasons:
First, always consider the run type. When you run at easy effort, your values will be lower than in faster sessions. That is completely normal and expected.
Do pay attention if:
- your easy runs are consistently tracking below your personal band across multiple weeks
- you notice the values are dropping lower than usual for longer runs (a sign of form breakdown under fatigue — worth tracking)
- you have recently changed shoes or running surface (e.g. from road to trails)
- SmoothOperator drops low (in green band or even below) across multiple consecutive easy runs with no obvious cause.
How to Improve It Over Time?
First, check (with a coach if possible) whether you need to improve or are already working in your optimal range. It is still useful to track your SmoothOperator to pick up any unexpected changes.
Improving SmoothOperator is about training your body to stay low and drive forward. Here are a few tips:
- Increase your cadence gradually. Research (Heiderscheit et al., 2011) shows that increasing your step rate by 5–10% above your preferred cadence measurably reduces vertical oscillation without increasing oxygen consumption. Try increasing by 5 steps per minute over a few weeks.
- Strength and drill work. Hip extension drills — A-skips, bounding, and stiff-legged runs — train your body to push backward and downward (which drives you forward) rather than upward. These are standard tools in any athletics programme. A strong core and stable hips reduce unnecessary vertical movement. Gym exercises like single-leg squats, glute bridges, and planks are also directly relevant.
- Running form coaching. A session or two with a qualified running coach or physiotherapist for a gait analysis can identify whether you have specific technique habits causing excess bounce. Many sports physios offer video gait analysis.
- Build overall running fitness. Improved aerobic conditioning leads to naturally better form. Many runners find their SmoothOperator improves simply as a consequence of becoming fitter — without deliberate technique work.
- Track trends, not single runs. Look for steady improvement over 6–12 weeks.